Data-Driven
Infographics
AI Editing
Prompt-Based
Social Ready
One-Click Share
Reusable
Refresh Anytime
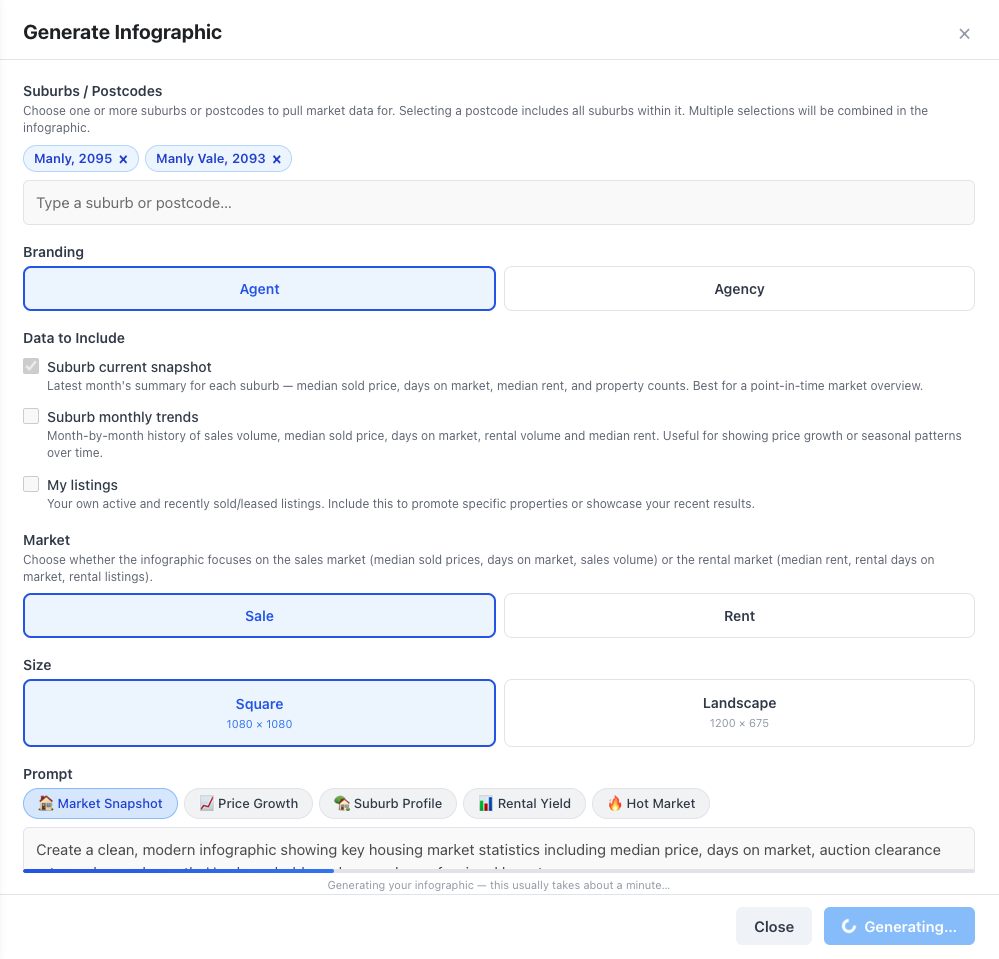
GENERATE
Create Stunning Infographics in Seconds
Generate branded infographics straight from the platform. Select the suburbs you want to cover, choose which data to include — suburb snapshots, market trends, or your own listings — and decide whether to brand them with your personal profile or your agency. The AI does the rest.
- ✓Pick suburbs, data sets and branding in a few clicks
- ✓Generated with real, up-to-date market data
- ✓Agent profile or agency branding — your choice
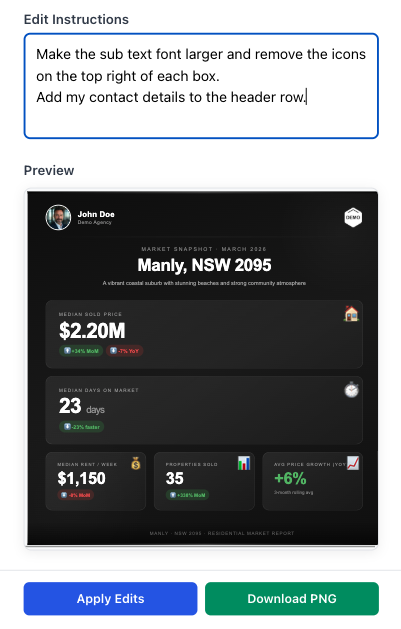
AI EDITING
Refine Any Detail With an AI Prompt
Use the mobile-friendly editor to tweak your infographic before sharing. Add an AI prompt to adjust headlines, statistics, colours or layout — then download a polished image ready for Instagram, Facebook or your email newsletter.
- ✓AI prompt-based editing for fast bulk changes
- ✓Mobile-optimised editor — create on the go
- ✓Download a share-ready image in one tap
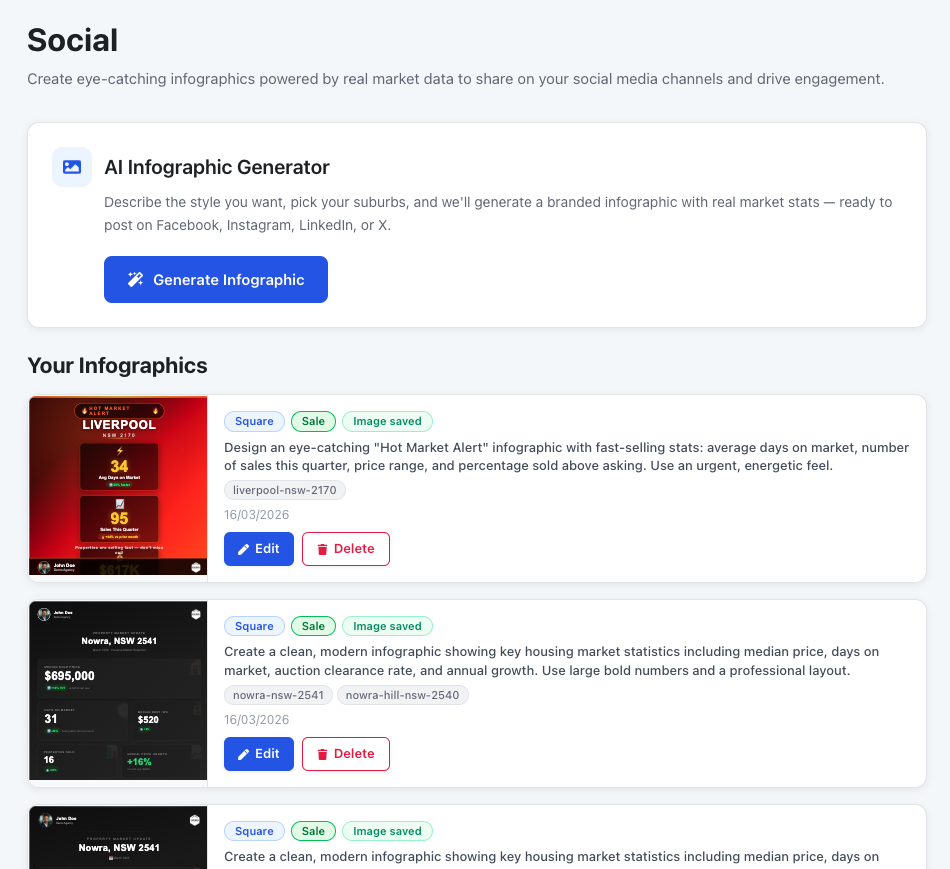
MANAGE
View, Reuse & Refresh Past Infographics
Every infographic you create is saved to your library. Instead of starting from scratch, open any previous design, refresh it with the latest data, and publish again. Keep a consistent visual style across all your content.
- ✓Full library of every infographic you've created
- ✓Open a past design and update with new data instantly
- ✓Maintain a consistent brand look over time